
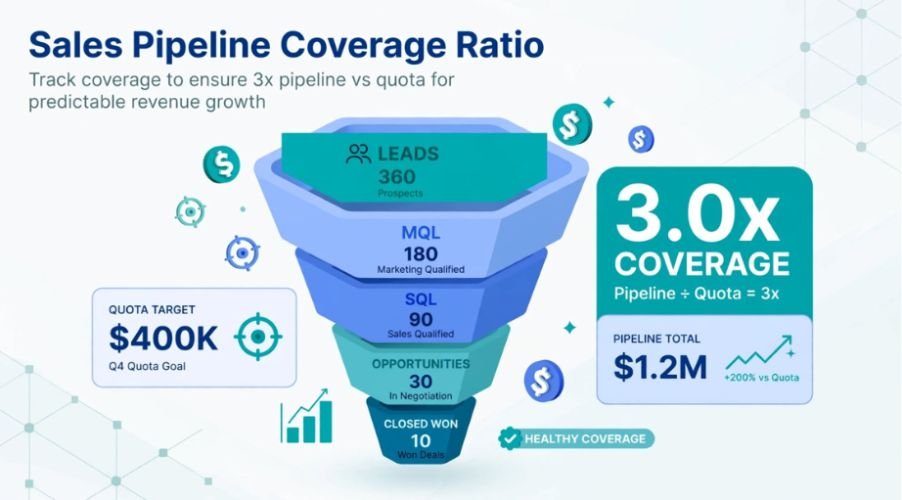
I spent my early sales leadership years relying on the universal 3:1 coverage rule. Every Monday forecast meeting followed the exact same script: if the team showed $3 million in opportunities against a $1 million quarterly quota, we celebrated our apparent safety.
Then came the end-of-quarter misses.
Applying a single, blanket sales pipeline coverage ratio by industry or segment is one of the most expensive mistakes a revenue leader can make. The required cushion to protect your quota is not arbitrary. It is mathematically tethered to sales cycle complexity, deal size, and actual win rates.
The 3:1 Myth: Why Inverse Win Rates Dictate Coverage
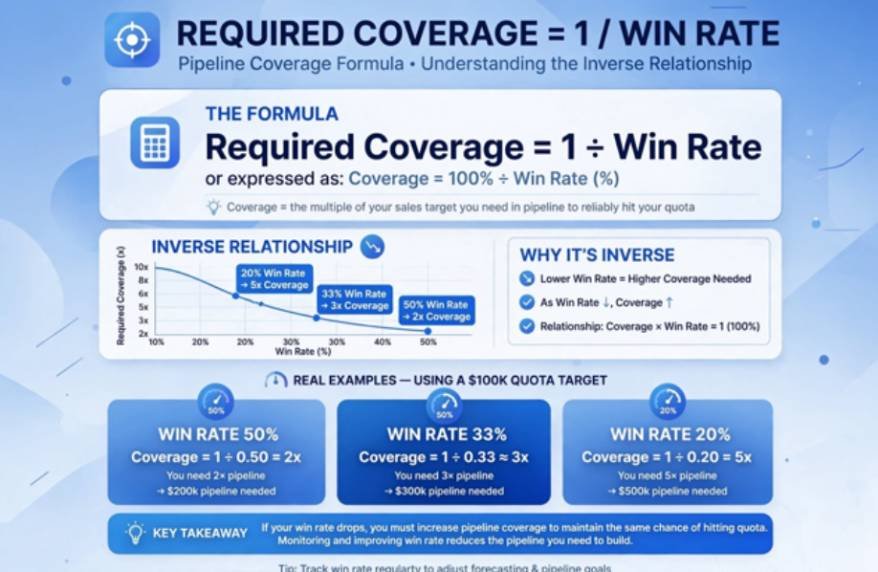
The standard formula for pipeline coverage looks deceptively simple:
$$\text{Pipeline Coverage Ratio} = \frac{\text{Total Qualified Pipeline Value}}{\text{Sales Quota}}$$
Many teams run into trouble because they view this number in isolation. A team’s required target coverage is actually the mathematical inverse of its genuine win rate:
$$\text{Required Coverage} = \frac{1}{\text{Historical Win Rate}}$$
If your closing rate across qualified deals is 33%, a 3x ratio hits quota ($1 \div 0.33 = 3.03$). But if your enterprise reps close 20% of pipeline opportunities, running a 3x coverage strategy guarantees a revenue shortfall of roughly 40%.
According to data compiled in HubSpot’s Sales Research, healthy coverage ranges widely from 2.5x to over 6x across various commercial models.
A blanket multiple fails because transactional models and multi-stakeholder enterprise deals behave entirely differently.
To build predictable forecasts, you must align targets with b2b sales pipeline stage conversion benchmarks.
Sales Pipeline Coverage Ratio by Industry and Market Segment
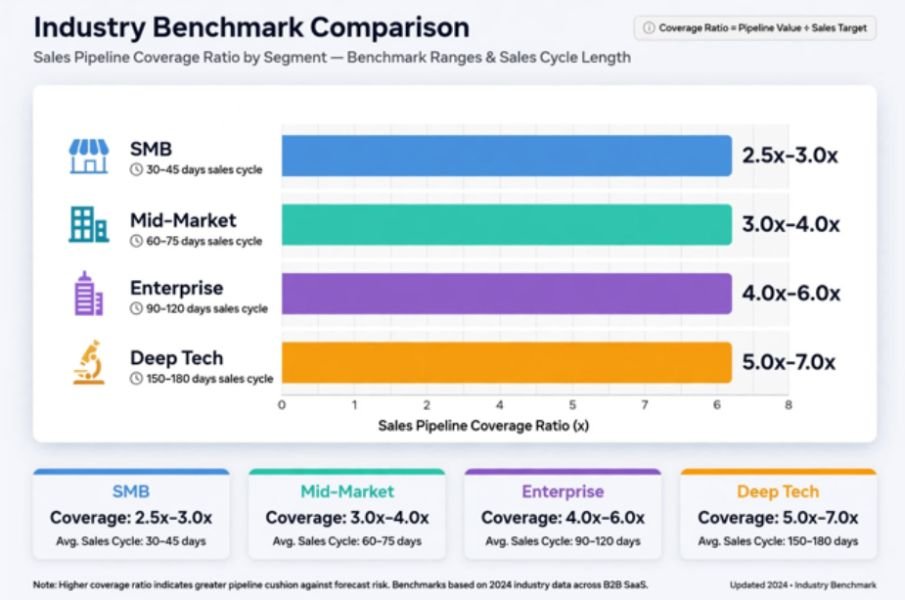
Shorter sales cycles and higher transaction volumes naturally require less insurance against deal slippage. Conversely, multi-month buying committees, deep technical evaluations, and custom procurement processes demand a much wider margin for error.
Benchmark Comparison Table
| Sales Segment & Industry | Average Win Rate | Target Coverage Ratio | Sales Cycle Length | Core Volatility Drivers |
| SMB & Transactional SaaS (Point Solutions, E-comm) | 30% – 40% | 2.5x – 3.0x | 14 – 45 Days | High deal volume, single decision-maker, low slippage risk. |
| Mid-Market B2B & Pro Services (Consulting, IT Services) | 25% – 33% | 3.0x – 4.0x | 45 – 90 Days | Departmental sign-offs, standardized security checks. |
| Enterprise B2B Software (ERP, Cyber, Infrastructure) | 15% – 25% | 4.0x – 6.0x | 90 – 180+ Days | Multi-stakeholder reviews, procurement, legal redlines. |
| Deep Tech & New Territories (Emerging Verticals, AI) | Variable (<15%) | 5.0x – 7.0x | 120 – 240+ Days | Lack of baseline conversion data, budget allocation shifts. |
Data synthesized across Salesforce State of Sales releases, industry benchmark reports, and revenue operations performance audits.
High-Velocity SMB vs. Complex Enterprise Motions
Transactional sales environments rely on momentum. A customer service tool selling for $6,000 annually closes rapidly, meaning an individual stalled deal never threatens the entire quarter. SMB teams can safely operate at 2.5x to 3.0x coverage because backfilling lost pipeline takes days rather than quarters.
Enterprise software operates under opposite dynamics. Enterprise buyers now involve 6 to 10 distinct stakeholders, according to Gartner Sales Research. When a six-figure contract encounters sudden budget freezes, security audits, or executive turnover, the closing date often shifts by multiple quarters. Maintaining 5x to 6x pipeline allows enterprise teams to absorb deal attrition without missing revenue targets.
The Phantom Pipeline: 3 Traps Inflating Your Ratio
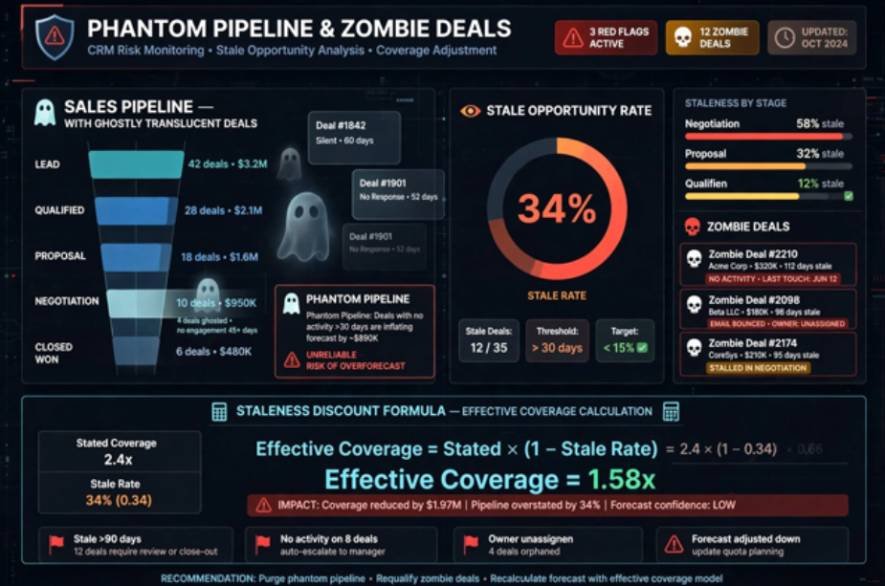
A team can boast a 4.5x coverage ratio on paper while sitting on an empty pipeline. In my consulting work, audits consistently reveal three hidden flaws that mask revenue vulnerability.
The Staleness Discount: Calculating Effective Pipeline
The most common culprit is zombie pipeline—deals sitting past their realistic close date without genuine prospect activity. Sales reps often leave these opportunities open to avoid difficult pipeline review conversations.
To correct this distortion, calculate your Effective Coverage Ratio:
$$\text{Effective Coverage} = \text{Stated Coverage} \times (1 – \text{Stale Opportunity Rate})$$
If an enterprise software division reports a 4.0x coverage ratio, but 30% of those deals exceed the typical sales cycle length, the real coverage is only:
$$4.0 \times (1 – 0.30) = 2.8\text{x}$$
At 2.8x, an enterprise team with an average 20% win rate faces an imminent pipeline deficit. Rather than letting these opportunities sit in limbo, RevOps teams should deploy automated workflows for reviving stalled sales pipeline opportunities or purging them entirely.
Stage Decay and Concentration Exposure
Coverage quality depends heavily on where opportunities sit within the funnel.
- Stage Weighting: Early discovery deals carry far lower close probabilities than opportunities in final procurement. Entering a quarter with 4x coverage composed of 80% Stage 1 opportunities is statistically equivalent to holding less than 2x real coverage.
- Whale Bias: When two or three large contracts represent more than 40% of your total pipeline value, aggregate metrics collapse. If one enterprise deal slips out of the quarter, the apparent safety cushion vanishes immediately.
How I Calculate Risk-Adjusted Coverage in Practice
To replace guesswork with verifiable data, I evaluate pipeline using a weighted framework across four operational variables:
- Segment Win Rate: Calculate historical closing rates per segment over the trailing four quarters, excluding outliers.
- Cycle Multiplier: Tag any deal older than 1.5 times the average sales cycle as dead weight.
- Stage-Adjusted Value: Apply probability weights based on verified conversion milestones rather than rep intuition.
- Whale Capping: Cap individual deal values at 20% of the aggregate rep quota when determining baseline coverage.
This disciplined approach ensures that your pipeline coverage metric functions as an accurate leading indicator of revenue rather than a false sense of security.
Frequently Asked Questions
1. What is the ideal sales pipeline coverage ratio?
The ideal ratio equals 1 divided by your win rate, typically ranging from 2.5x for SMB to 5x+ for enterprise teams.
2. Does higher pipeline coverage always mean better performance?
Ratios above 7x or 8x typically indicate poor qualification, bloated valuations, and stale CRM records.
3. How frequently should RevOps audit pipeline coverage?
Teams should review coverage metrics bi-weekly and conduct deep-cleaning CRM purges monthly.
4. How does sales cycle length impact required coverage?
Longer sales cycles increase deal slippage risk, requiring a higher coverage multiple to safeguard the quota.
Stop Hoarding Dead Deals and Build Predictable Pipeline
A bloated pipeline does not hit targets; closed contracts do. If your CRM shows 4x coverage but your reps are missing quota, you are carrying phantom deals.
Audit your CRM this week. Strip out deals with zero buyer engagement over the past 30 days, re-run your coverage math using your genuine historical win rate, and calibrate prospecting around true required volume. Predictable revenue starts the moment you trade comforting illusions for rigorous pipeline hygiene.