

If you need 500 leads to close one deal, you don’t have a closing problem. You have a conversion problem at the top of the funnel. I’ve audited 70+ B2B pipelines in the last two years, and b2b sales pipeline stage conversion benchmarks reveal the same pattern every time.
Most teams track vanity metrics. Top teams track stage-to-stage conversion and fix the leaks. Here is what average looks like versus what high-performers actually hit in 2026.
The Benchmarks Everyone Quotes But Few Understand
I pulled aggregated data from across SaaS, services, and enterprise sales motions. Conversion rates differ by source maturity, but these ranges hold.
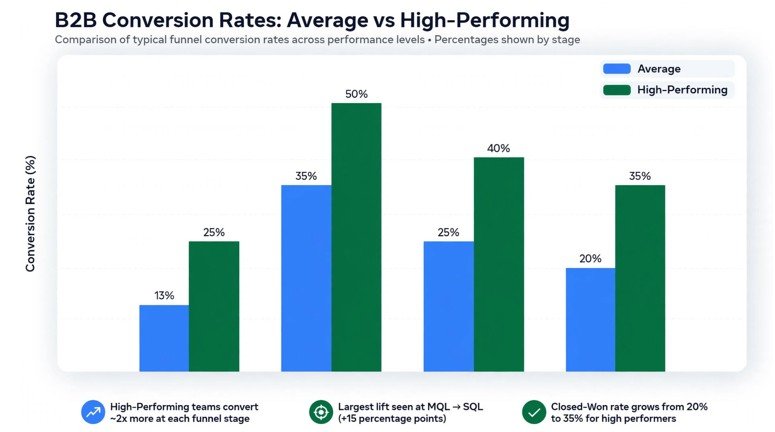
| Pipeline Transition | Average Teams | High-Performing Teams |
| Lead → MQL | 20% – 25% | 35% – 40% |
| MQL → SQL | 12% – 15% | 25% – 40% |
| SQL → Opportunity | 30% – 50% | 54% – 70% |
| Opportunity → Closed-Won | 20% – 25% | 30% – 35% |
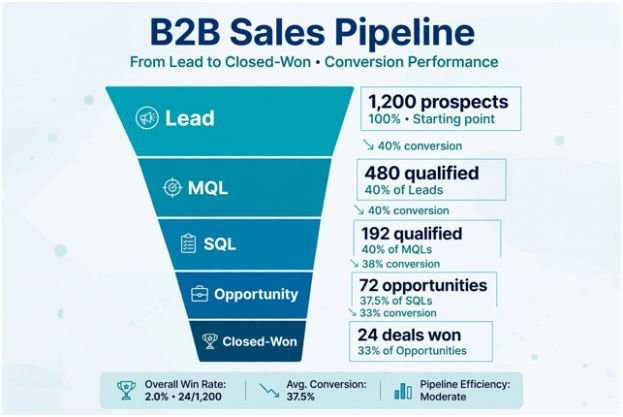
Net conversion from raw Lead to Closed-Won sits at 0.2% to 0.9% for average orgs. That is why pipeline feels so inefficient.
Lead to MQL Conversion Rate
This measures if your targeting works. Average is 20-25%. High-performers hit 35-40% because they define MQL on intent plus fit, not just form fills. According to HubSpot’s latest lead generation benchmarks, companies with tight ICP definitions convert leads to MQLs at nearly 2x the rate of broad targeting.
MQL to SQL – The Cliff Where Most Pipelines Die
This is the number one leak. Average teams convert only 12-15% of MQLs to SQLs. When I see a rate under 13%, it usually means marketing and sales disagree on what “qualified” means. High-performing orgs get 25-40% here. Product-led teams often see even higher rates because product-qualified leads carry real intent.
SQL to Opportunity and Opportunity to Closed-Won
Once sales accepts a lead, average conversion to a validated Opportunity is 30-50%. High-performers push 54-70%. That gap comes down to discovery.
Your win rate from Opportunity to Closed-Won should be 20-25% on average. Elite teams hit 30-35%. Salesforce data consistently shows that win rates alone don’t predict revenue attainment — pipeline coverage does.
Why Your Conversion Rates Vary So Much
Benchmarks are useless without context. Two factors change everything.
Inbound vs Outbound vs PLG Motion
Outbound cold sits at the low end of every benchmark. High-intent inbound sits at the high end. In my experience, a sales-assisted PQL converts from MQL to SQL at 39%+, while cold outbound struggles to hit 10%. You can’t compare those motions directly.
SMB vs Enterprise Deal Complexity
Enterprise cycles run 6-18 months with 6-10 stakeholders. Harvard Business Review research shows enterprise buying committees now involve more decision-makers than ever, which crushes mid-funnel velocity. SMB deals with one decision-maker convert 2-3x faster at each stage. If you want to shorten enterprise sales cycles, you need to fix stakeholder mapping at the SQL stage, not proposal stage.
How I Use These Benchmarks to Build Pipeline Coverage
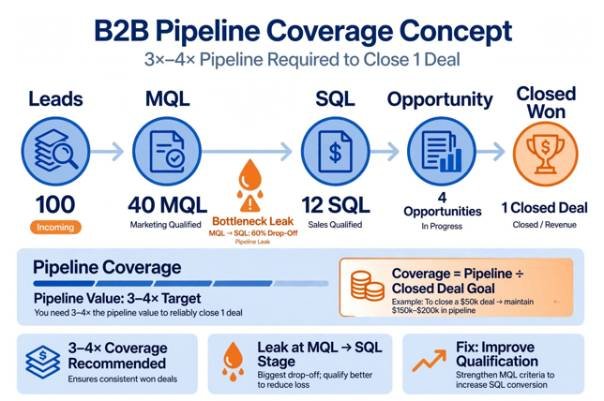
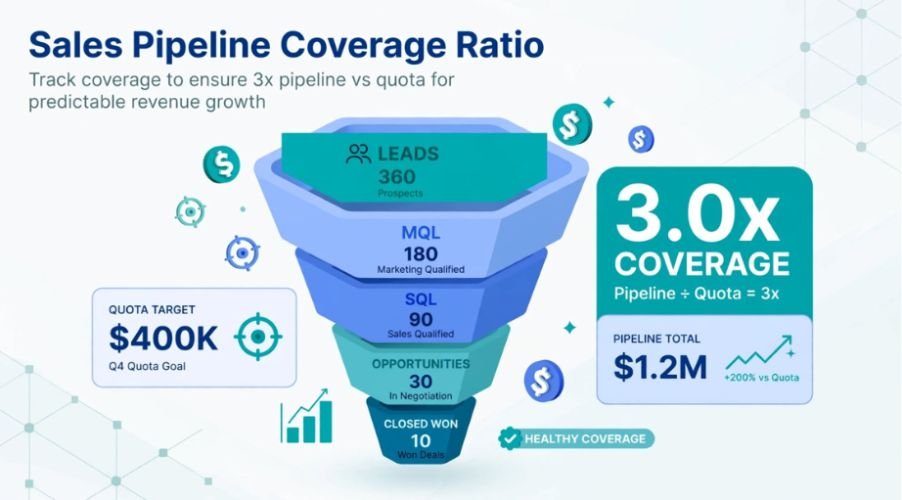
Here is the original math most articles skip. Because win rates hover around 20-25%, you need 3x to 4x pipeline coverage versus quota.
Let’s say you need to close $1M with a $50k ACV. You need 20 wins.
Average Team Math:
You need 80-100 Opportunities → 200-333 SQLs → 1,333-2,775 MQLs → 5,332-13,875 Leads.
High-Performing Team Math:
You need 57-67 Opportunities → 81-124 SQLs → 204-496 MQLs → 510-1,417 Leads.
Same revenue target. Ten times less lead volume. That efficiency is the difference between burning SDRs and scaling.
3 Fixes That Moved My Clients From Average to Top Quartile
I don’t tell clients to get more leads. I fix the leaks.
First, I align MQL and SQL definitions in one room. Marketing, SDR, and AE agree on firmographics plus three behavioral intent signals. That alone lifted MQL→SQL from 11% to 28% for a Series B SaaS client.
Second, I kill bad lead sources. If a source converts Lead→MQL under 15%, I pause it. More bad leads never fixes conversion.
Third, I enforce a mutual close plan at Opportunity creation. Teams that co-build close plans with the buyer see Opportunity→Closed jump from 21% to 32% in two quarters.
Stop Guessing Your Funnel Math, Start Fixing One Stage
B2B sales pipeline stage conversion benchmarks are not grades. They are diagnostic tools.
Find your worst stage versus the average table above. Fix only that stage for 30 days. Measure again. Most teams I work with need just one stage improvement to hit quota without adding a single extra lead.
Audit your current conversion rates today. Compare them to the high-performing column. That gap is your revenue plan.
FAQs
1. What is a good B2B lead to closed-won conversion rate?
A good net rate is 0.9%+ average, 1.4-3.9% for high-performers, meaning 25-70 leads per win.
2. What is the most important B2B pipeline conversion benchmark?
MQL to SQL, because a rate under 13% signals misaligned ICP and wastes all downstream effort.
3. How much pipeline coverage do I need if my win rate is 25%?
You need 4x coverage of your quota to be safe, as 25% win rate means 3 out of 4 opportunities will not close.
4. Why do enterprise B2B conversion rates drop faster than SMB?
Enterprise deals involve larger buying committees and longer cycles, which lowers stage-to-stage velocity and conversion by 30-50%.

5 thoughts on “B2B Sales Pipeline Stage Conversion Benchmarks: Average vs High-Performing Teams in 2026”