


Most sales territories are built on zip codes, political boundaries, and guesswork. I learned this the hard way when I inherited an enterprise territory map that gave one rep downtown Manhattan and another upstate New York, expecting identical pipeline returns. The result was predictable: one rep crushed quota without breaking a sweat, while the other burned out chasing low-intent logos.
Mastering b2b sales territory planning best practices means treating your territory design as a scientific revenue model rather than a map-drawing exercise. When companies align territories around real market potential, the payoff is immediate. Research by the Sales Management Association indicates that while 58% of sales organizations struggle with ineffective patch assignments, teams that optimize their territory plans drive 10% to 20% higher sales productivity and achieve up to 20% faster top-line growth.
Traditional Territory Design:
[Zip Codes / States] ──> [Arbitrary Account Count] ──> [Unequal Quotas & High Churn]
RevOps Data-Driven Model:
[ICP Intent Data] ──> [Effort-Weighted Capacity] ──> [Predictable Pipeline Growth]
Shift from Geographic Maps to Multi-Dimensional ICP Scoring
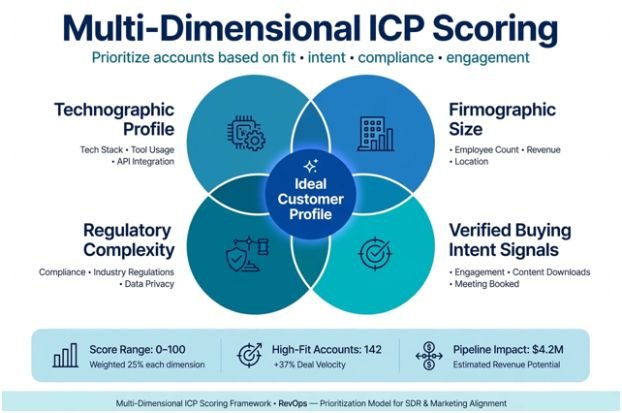
Relying on state borders or phone area codes creates massive inequities across your sales floor. A single enterprise logo with 10 subsidiaries demands vastly different sales resources than five single-location businesses.
I start every planning cycle by isolating accounts that mirror our top-performing customers across four specific layers: technographic profile, firmographic size, regulatory complexity, and verified buying intent signals.
Account Tiering and Data Indicators
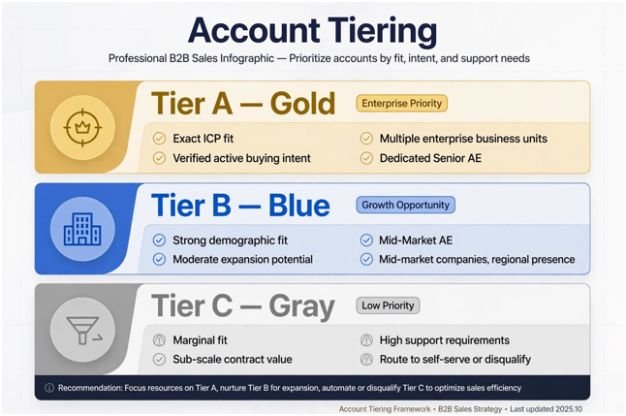
Segmenting targets by potential rather than raw revenue yields three clear action tiers:
| Account Tier | Defining Characteristics | Operational Motion |
| Tier A | Exact ICP fit, verified active buying intent, multiple enterprise business units. | Dedicated Senior Account Executive, multi-threaded outbound, executive sponsorship. |
| Tier B | Strong demographic fit, moderate expansion potential, no current intent spikes. | Mid-Market Account Executive, programmatic outbound cadences, digital nurture. |
| Tier C | Marginal fit, sub-scale contract value, high support requirements. | Route to inbound self-serve, automated nurture sequences, or disqualify. |
Dumping raw account lists into your CRM without these boundaries distorts rep focus. Tier C accounts act as productivity traps, pulling focus away from high-yield opportunities that determine your fiscal year.
Quantifying Rep Capacity with the Effort-Weighted Model
A common mistake in territory design is handing each seller an identical book of 100 accounts. Fifty complex enterprise accounts require hundreds of hours of buying committee mapping, security reviews, and custom demos. Conversely, 100 transactional mid-market accounts move rapidly with single-threaded approvals.
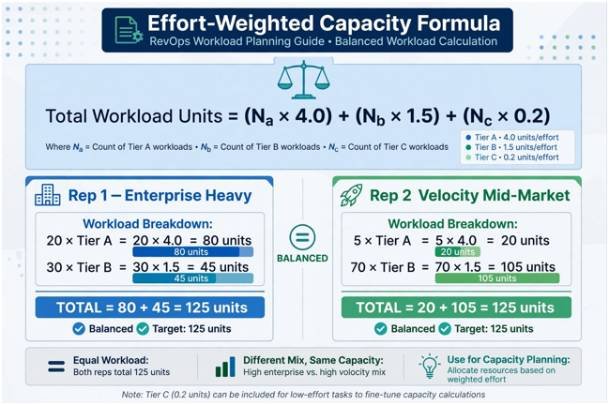
To solve this imbalance, I built the Effort-Weighted Capacity Formula (EWCF). Instead of tracking raw account volume, assign each account tier an effort unit based on expected quarterly touchpoints:
$$\text{Total Workload Units} = (N_A \times 4.0) + (N_B \times 1.5) + (N_C \times 0.2)$$
Where $N$ represents the account count within each respective tier.
Example Rep Capacity Comparison:
Rep 1 (Enterprise Heavy):
- 20 Tier A accounts (20 × 4.0 = 80 units)
- 30 Tier B accounts (30 × 1.5 = 45 units)
Total Load: 125 Workload Units (Balanced)
Rep 2 (Velocity Mid-Market):
- 5 Tier A accounts (5 × 4.0 = 20 units)
- 70 Tier B accounts (70 × 1.5 = 105 units)
Total Load: 125 Workload Units (Balanced)
By balancing total effort units instead of account counts, you guarantee equitable workloads across the sales team.
Accounting for Rep Ramp Dynamics
Never calculate capacity assuming your team operates at 100% efficiency year-round. According to research published by Harvard Business Review, sales capacity models fail most often because leadership ignores rep onboarding curves.
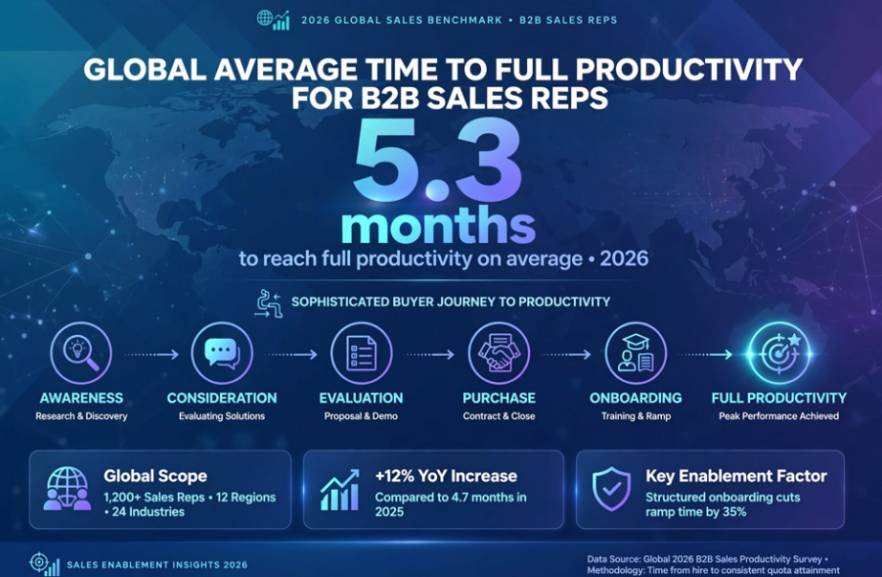
Factor in standard mid-market ramps of 90 to 120 days and enterprise ramps spanning six to nine months. If you assign a fully loaded patch to a ramping rep on day one, high-value accounts sit idle while competitors step into the vacuum. Always hold unassigned buffer books in reserve to cleanly feed new hires as they hit full operational speed.
Quota-to-Territory Alignment and Compensation Sync
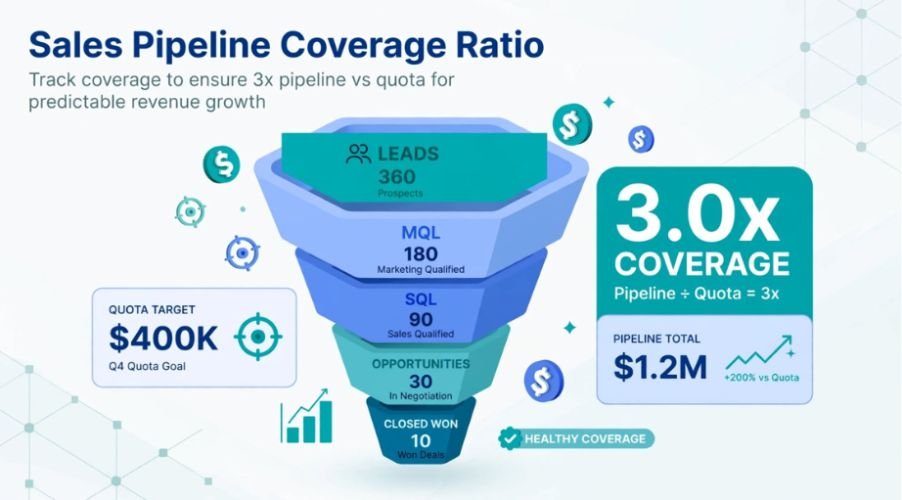
Territory design and quota allocation cannot happen in separate silos. When RevOps cuts patches without validating coverage against historical win rates, top performers leave. Before finalizing boundaries, audit your pipeline health and cross-reference your historical b2b sales pipeline stage conversion benchmarks to ensure each patch realistically yields 3x to 5x quota coverage.
Target Quota per Rep: $1,000,000 ARR
Required Pipeline (at 25% Stage-to-Close Rate): $4,000,000
Total Territory Weighted Potential: Must Exceed $4,500,000 to Absorb Slippage
Eliminating Coast and Burnout Zones
Imbalanced territories produce two toxic environments on a sales floor:
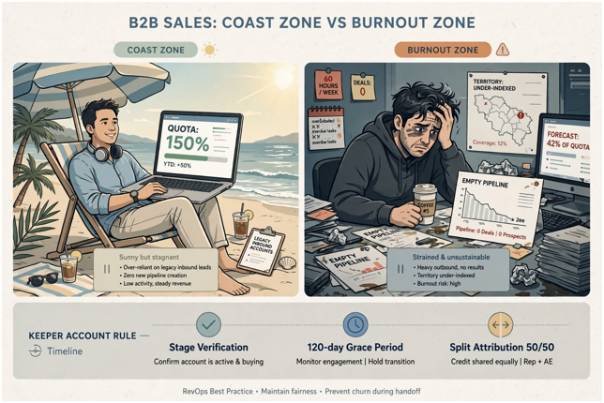
- The Coast Zone: An account patch packed with legacy inbound accounts where an average rep hits 150% of quota through passive renewals alone.
- The Burnout Zone: An under-indexed territory where an exceptional rep works 60 hours a week, converts at an elite clip, yet misses quota due to lack of baseline market opportunity.
To keep talent engaged across all regions, pair updated territory boundaries with systems that structure tiered sales commission plans. Aligning compensation logic directly to territory difficulty ensures reps working greenfield patches earn fair accelerators for generating net-new logos.
Segment Sales Motions by Rep Strengths
Complex sales cycles require distinct seller skill sets. Forcing a transactional velocity rep into an enterprise patch usually leads to stalled multi-stakeholder deals. Analysis from Gartner highlights that modern revenue operations require strict specialization between land-and-expand motions and high-velocity acquisition.
| Parameter | Mid-Market Motion | Enterprise Strategic Motion |
| Sales Cycle Duration | 30 to 60 days | 6 to 12 months |
| Stakeholder Depth | 1 to 3 buyers | 6 to 15 committee members |
| Ideal Rep Profile | High cadence, rapid qualification | Complex negotiation, technical fluency |
| CRM Ownership Rule | Strict round-robin within segment | Named account exclusivity |
Enforce clear account ownership fields within your CRM. When mid-market and enterprise reps spar over account jurisdiction, prospects receive duplicate, conflicting outreach that degrades your brand.
Quarterly Dynamic Governance and the “Keeper Account” Rule
The annual, static territory rollout is dead. High-growth sectors move too fast for plans set in stone every December. I run quarterly territory reviews to monitor changes in account health, regional economic contractions, and hiring adjustments.
However, agility must not undermine rep trust. When you rebalance territories mid-year, implement a clear “Keeper Account” governance framework:
- Stage Verification: If a rep moves an opportunity past technical discovery (e.g., Stage 2 or higher) within the last 90 days, the account remains with that rep until close.
- Grace Period Limits: The original rep retains closing rights for 120 days post-rebalance. If the deal fails to close within that window, ownership transfers to the new patch owner.
- Split Attribution: For complex transitions, split commission credit (e.g., 50/50) between outgoing and incoming reps to ensure seamless customer handoffs.
This policy protects pipeline continuity, keeps reps focused on selling during territory shifts, and prevents internal friction.
Frequently Asked Questions About B2B Sales Territory Planning
1. How often should sales territories be restructured?
Review territory performance quarterly, but restrict structural boundary changes to an annual cadence to avoid pipeline disruption.
2. What is the biggest risk of territory rebalancing?
Rep turnover caused by perceived unfairness and disruption to active sales deals are the primary risks.
3. How do you balance territories without historical company data?
Use third-party intent data, industry verticals, and verified company headcount bands as proxy metrics for market opportunity.
4. What tools manage modern B2B sales territory planning?
Platforms like Salesforce Maps, Fullcast, Xactly, and Everstage automate dynamic routing, account scoring, and compensation synchronization.
Burn the Zip Code Maps: Your Next Operational Move
Ditching geographic territories in favor of intent-driven, effort-weighted patches transforms sales performance. It stops internal disputes, reduces quota failure, and gives leadership a predictable model for revenue growth.
Start your transition with a clean territory audit. Run your current target accounts through the Effort-Weighted Capacity Formula above, flag any rep assigned over 140 effort units, and carve out those overloaded accounts to create immediate pipeline capacity for your next sales hire.

One thought on “B2B Sales Territory Planning Best Practices: RevOps Field Guide”